Can Indicators of Quality of Governance relate to Conflict? The Correlates of Governance and Conflict
(with bibliography)Executive Summary
Exploring the correlation between governance types and armed conflict using agglomerative hierarchical clustering on over 2000 variables reduced to their first 15 principal components. The analysis reveals clustering of countries with similar governance forms, particularly evident during peak armed conflict years like 2017.
International law operates under the assumption of an analogy between national systems and the international order. In domestic legal systems, the authority to resort to force, such as in self-defense, is typically held exclusively by established governance bodies. This authority is exercised through various mechanisms, including administrative actions, legislation, court decisions, and international activities like treaty agreements (Shaw, 2008).
Conflict remains a pervasive issue globally, notably in regions like the Middle East and Northern Africa, persisting for decades. Investigating whether countries with similar governance structures experience similar levels of armed conflict is crucial due to the inherent international involvement in conflicts, disrupting the established international order. To this end, country-year observations are grouped using agglomerative hierarchical clustering based on over 2000 governance-related variables, reduced to their first 15 principal components.
The analysis reveals patterns of clustering between pairs of countries and years, particularly notable in recent decades and peak conflict periods like 2017. While the direct relevance of governance types to conflict may not be immediately apparent at a general level, the clustering of conflict-prone countries during peak conflict years suggests a potential correlation worth exploring further.
Introduction
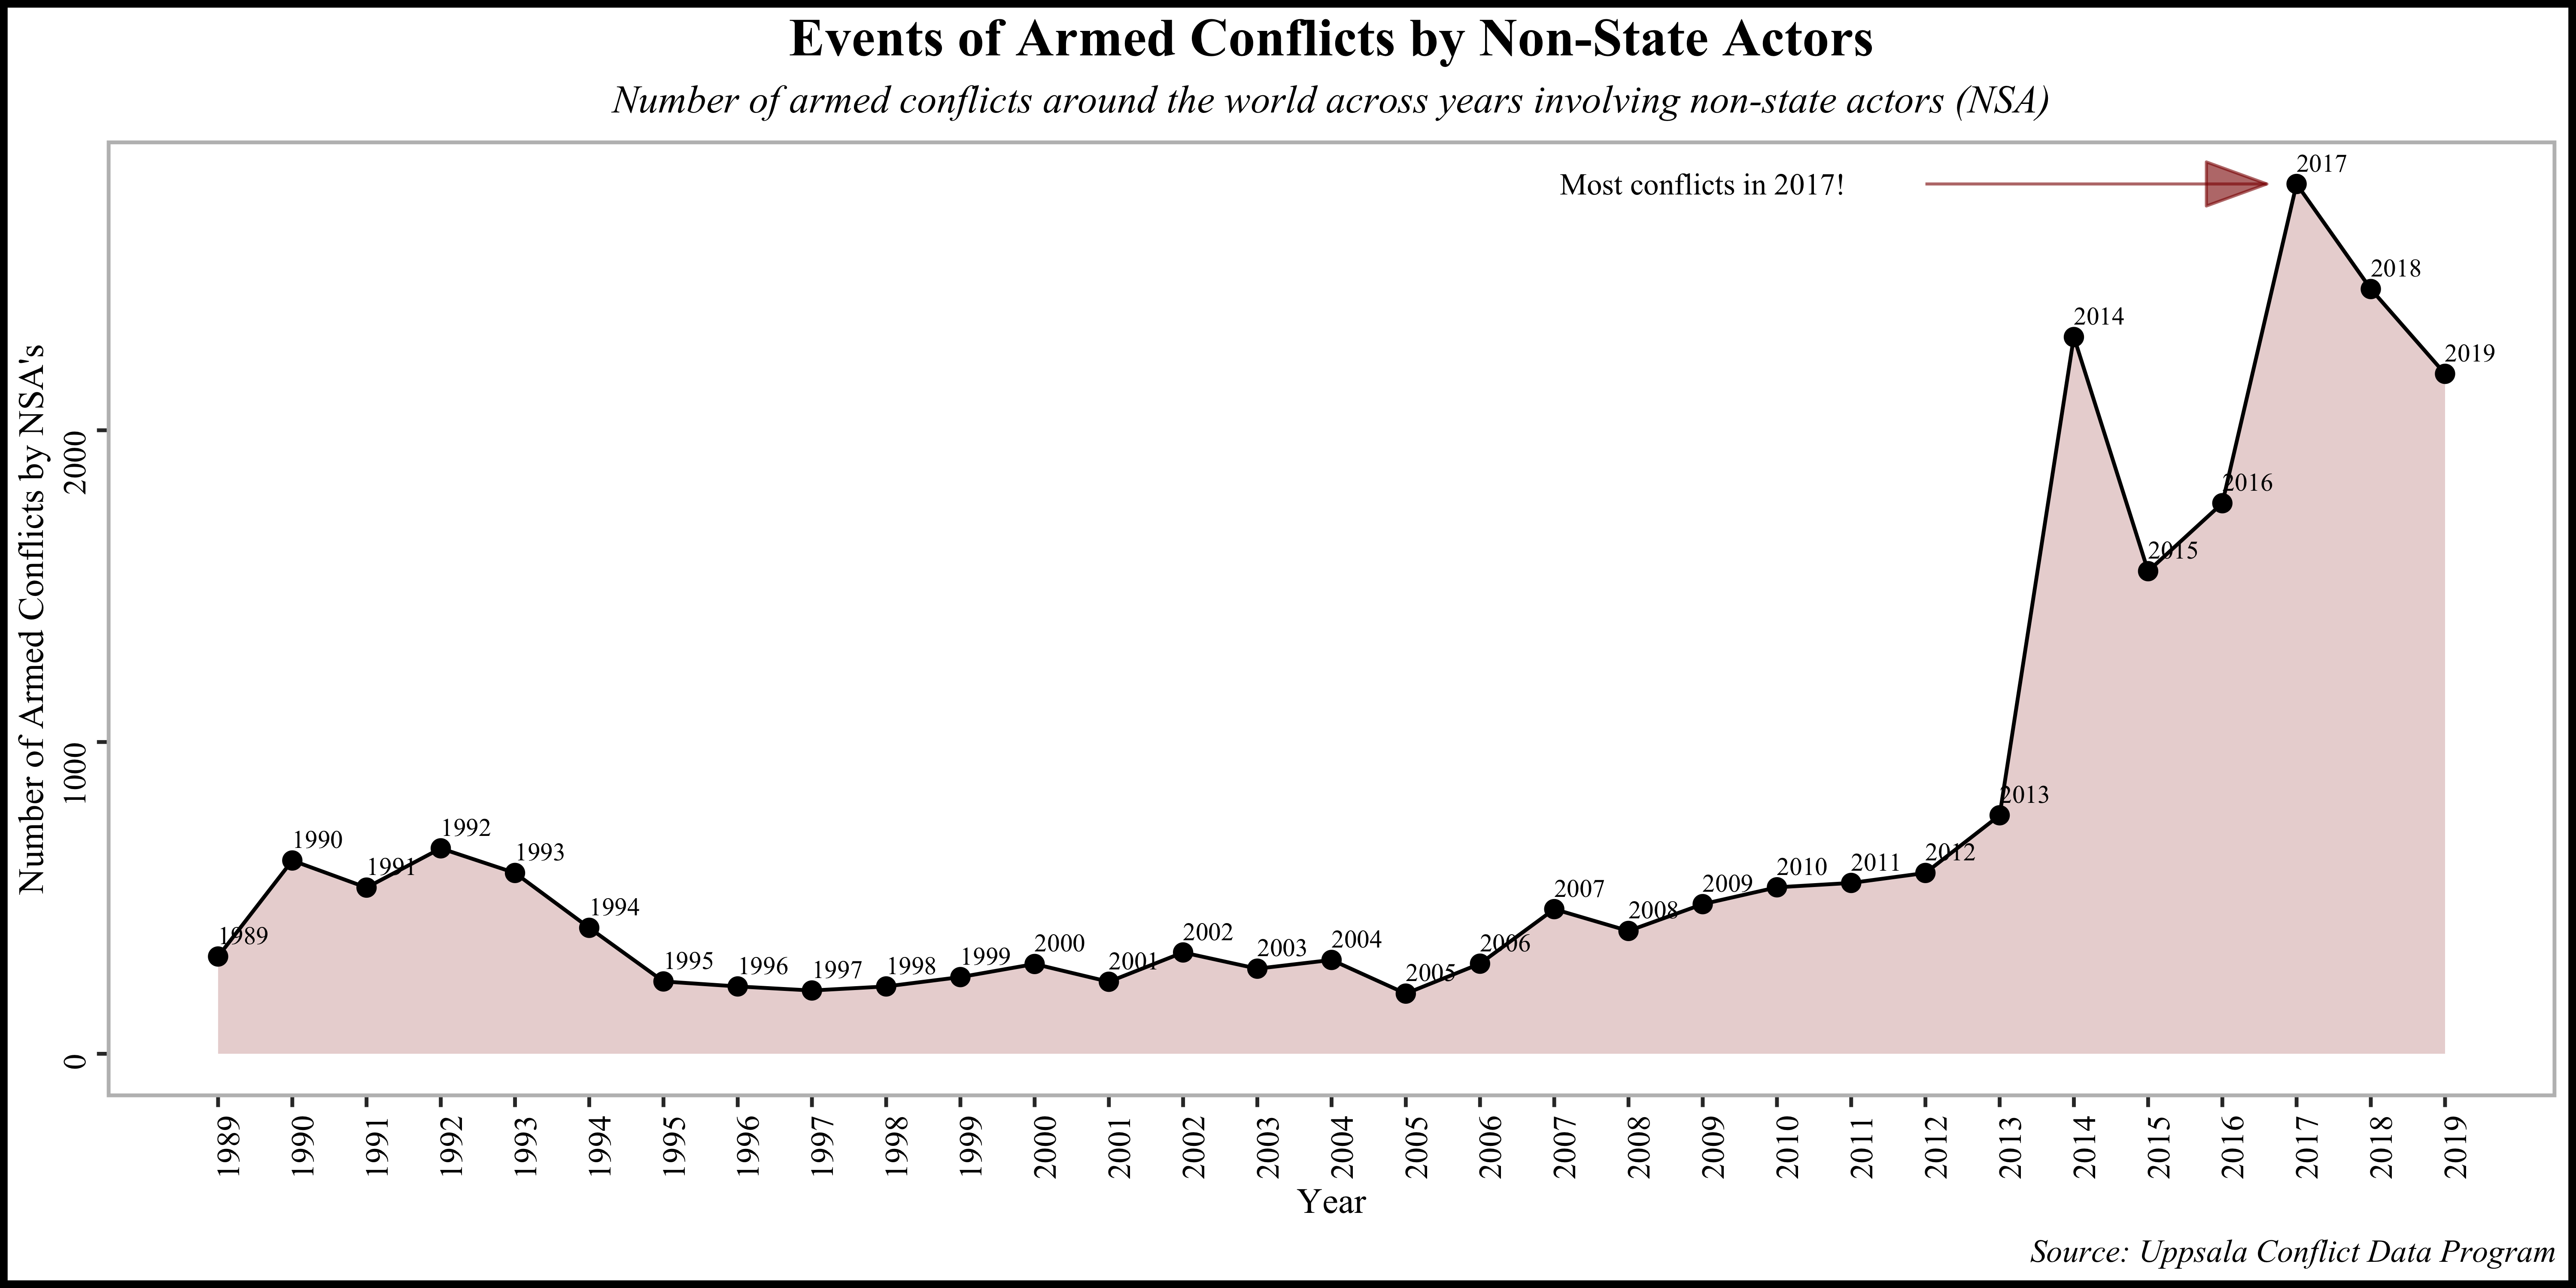
Armed conflicts pose significant challenges not only to a nation's socio-economic and political systems but also to its environment, leading to devastating man-made famines as witnessed in Yemen and Afghanistan amidst civil unrest and armed conflicts. The prevalence of non-state-based armed conflicts, notably in 2017, underscores the urgency of understanding the relationship between governance quality and conflict propensity.
Exploring whether countries with similar levels of governance quality experience comparable conflict levels is paramount for leveraging "good governance" as a preventive measure against future conflicts. However, defining governance quality entails more than just economic indicators like Gross Domestic Product (GDP) (Good Governments - Vallandingham.Me, n.d.). It encompasses measures addressing social progress and overall well-being, such as the Human Development Index (HDI) and Economic Freedom Score.
Utilizing the comprehensive dataset provided by the Quality of Governance Institute at the University of Gothenburg (Teorell et al., 2020), comprising approximately 2100 variables related to governance quality, the analysis begins with dimensionality reduction using Principal Component Analysis (PCA) . Additionally, Singular Value Decomposition via the data interpolating empirical orthogonal functions (DINEOF) addresses gaps in the dataset.
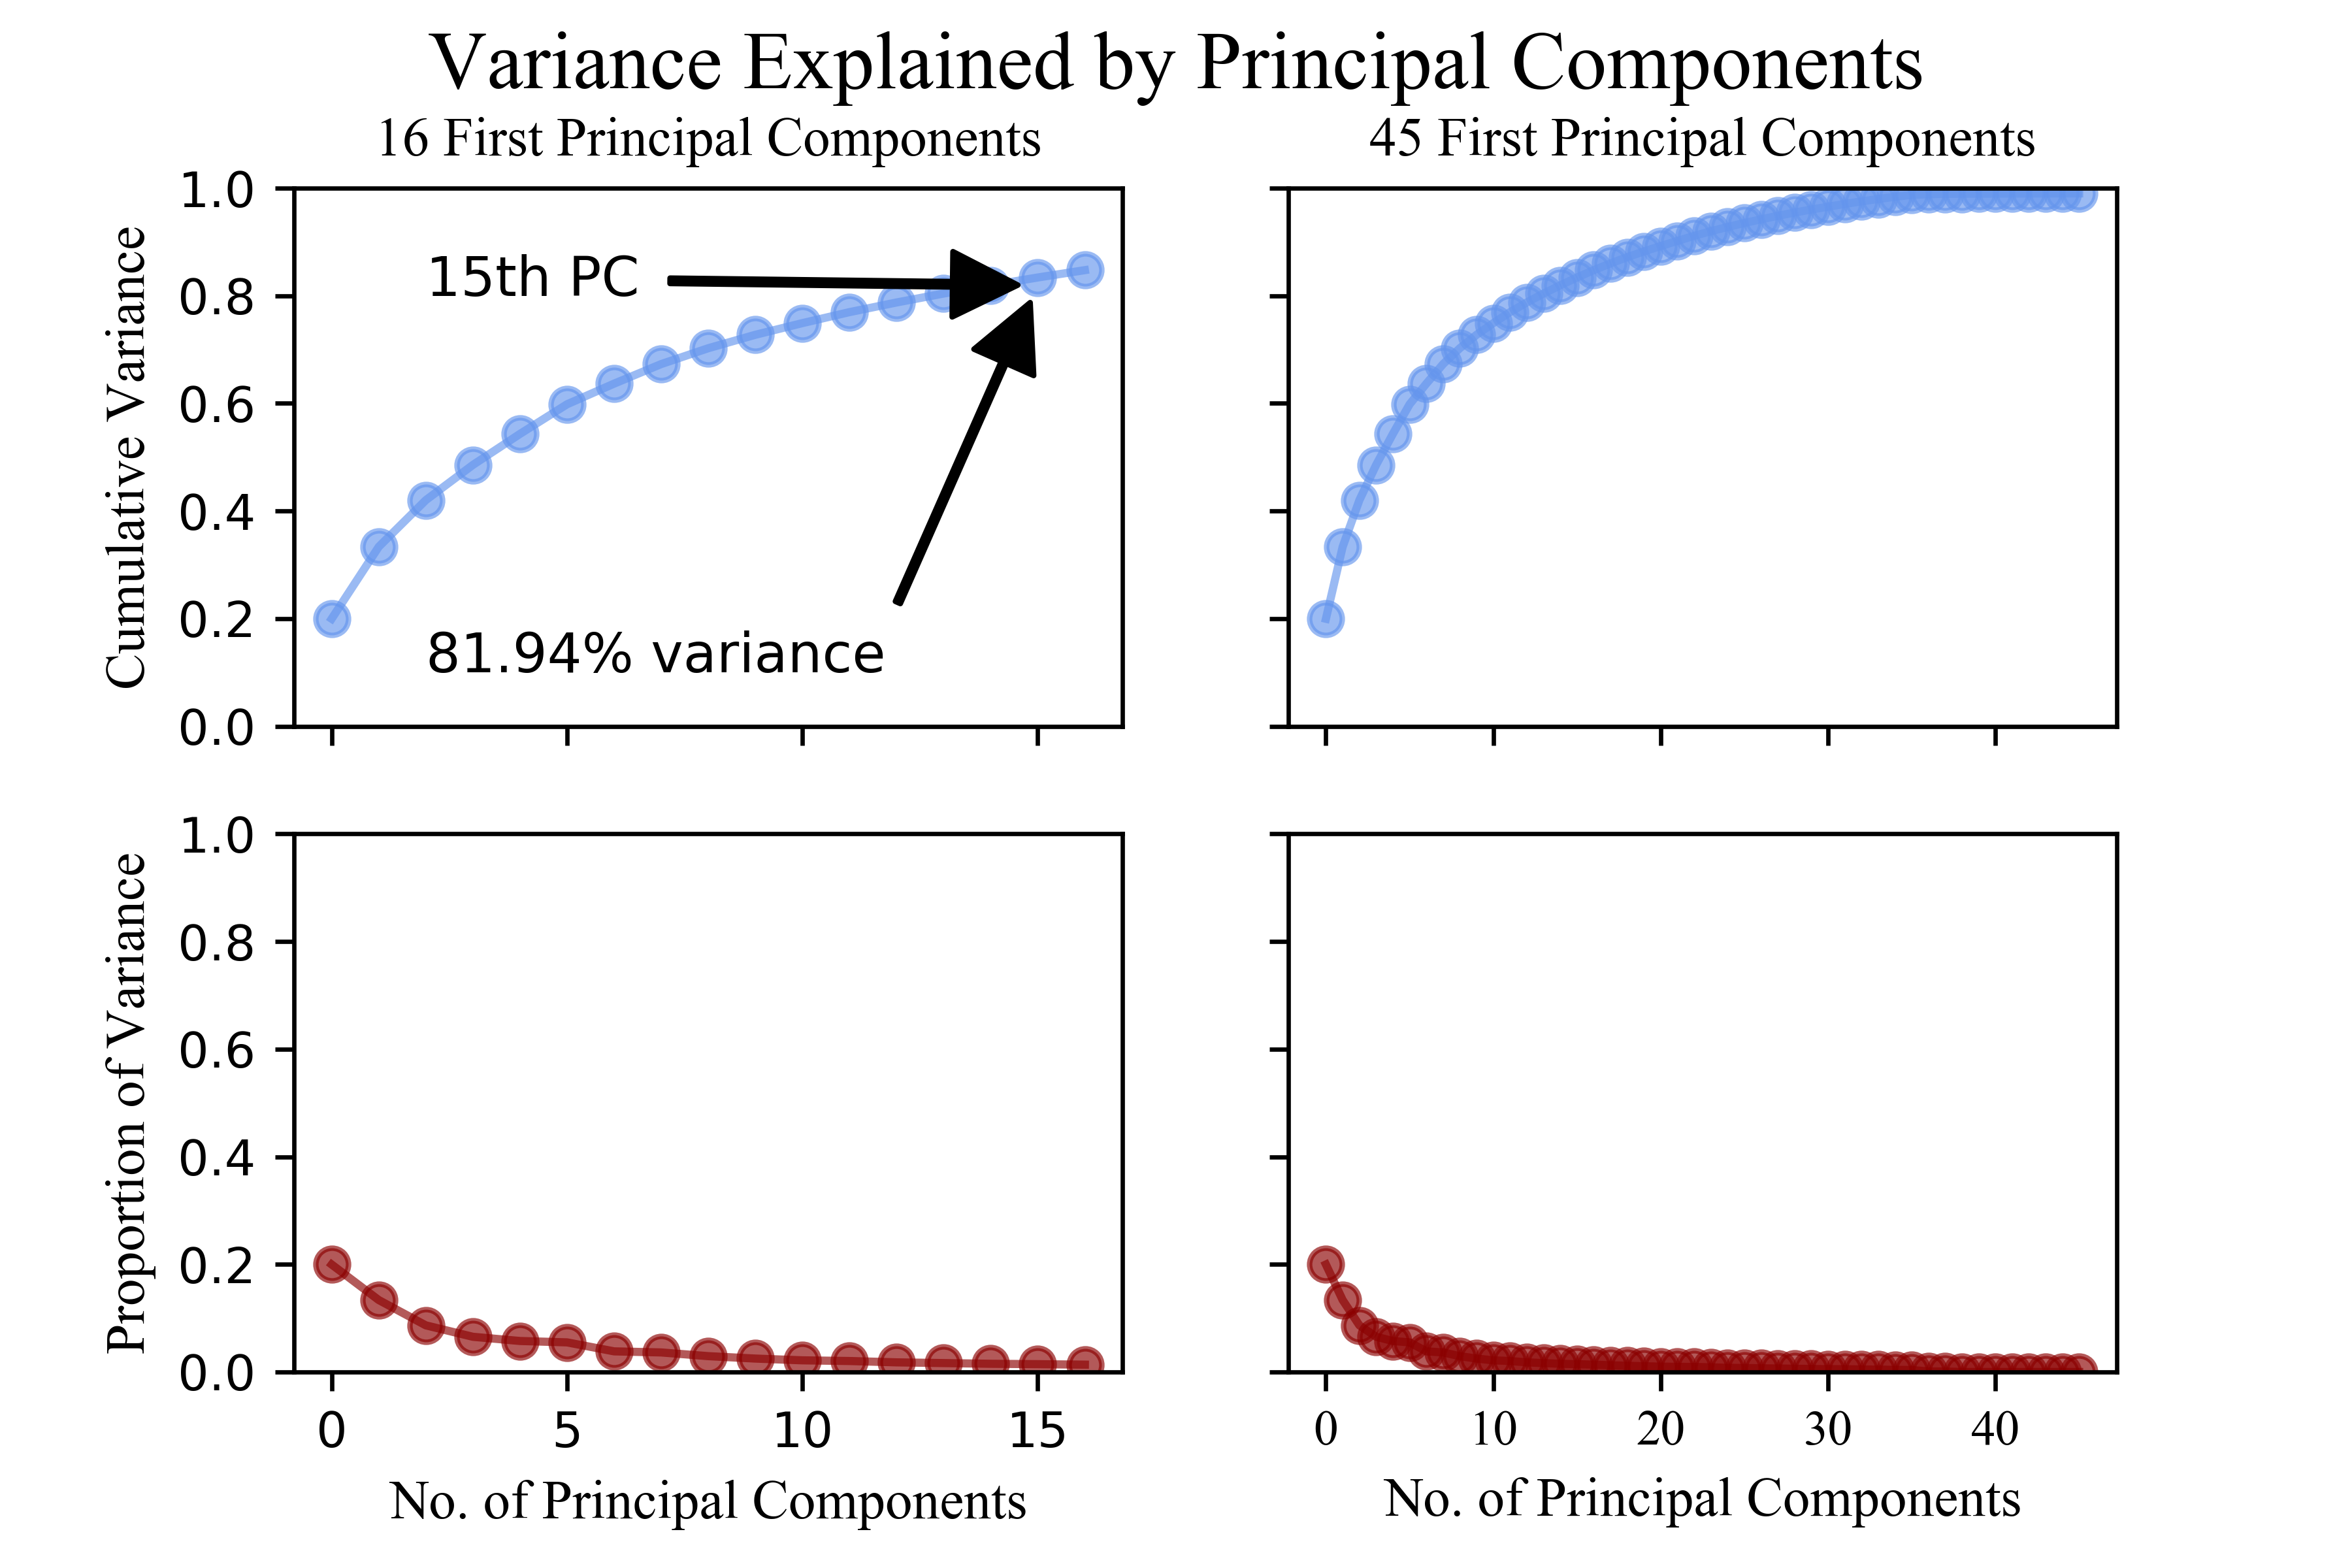
Agglomerative hierarchical clustering is then applied to identify clusters of similar country-year pairs based on the first 15 principal components, capturing 81.94% of the data's variance. While acknowledging the potential interpretational challenges of hierarchical clustering, its hierarchical nature aligns with the hypothesis of a hierarchical pattern in the governance data.
The ultimate objective is to ascertain whether variability in governance quality correlates with armed conflict levels. Leveraging the Georeferenced Event Dataset (GED) from the Uppsala Conflict Data Program (UCDP), armed conflict events are aggregated to the country-year level, with intensity ratings based on casualties, facilitating a comprehensive analysis of governance-conflict dynamics.
Data
Quality of Governance Standard Dataset
| Country Name | Year | PC1 | PC2 | PC3 | PC4 | PC5 | PC6 | PC7 | ||
| Count | 15324 | 15324 | 15324 | 15324 | 15324 | 15324 | 15324 | 15324 | 15324 | |
| Unique | 211 | |||||||||
| Mean | 1982.7 | 0 | 0 | 0 | 0 | 0 | 0 | 0 | ||
| St. Dev. | 21.37 | 34.23 | 28.01 | 22.55 | 19.59 | 18.39 | 17.97 | 15.0 | ||
| Min. | 1946 | -94.11 | -99.3 | -93.92 | -60.37 | -129.91 | -103.04 | -99.09 | ||
| 25% | 1964 | -26.21 | -17.34 | -15.91 | -12.95 | -11.01 | -12.27 | -7.46 | ||
| 50% | 1983 | 0.2 | -0.88 | 2.45 | -1.29 | -1.86 | -0.49 | 0.68 | ||
| 75% | 2001 | 23.18 | 14.7 | 15.22 | 10.16 | 9.61 | 10.25 | 8.47 | ||
| Max. | 2019 | 115.65 | 102.14 | 121.74 | 64.37 | 220.77 | 129.43 | 171.09 | ||
The Quality of Government (QoG) Institute, established in 2004, focuses on the empirical and theoretical aspects of high-quality political institutions. Their extensive research aims to address the creation and maintenance of such institutions, with datasets publicly available to analyze governance quality (Teorell J. et al., 2020).
The QoG Standard Dataset, a compilation dataset, provides a comprehensive time-series dataset spanning from 1946 to 2019, covering over 2000 variables related to governance quality across various thematic areas (Teorell J. et al., 2020). However, this dataset exhibits a high number of missing values, necessitating data cleaning and reduction.
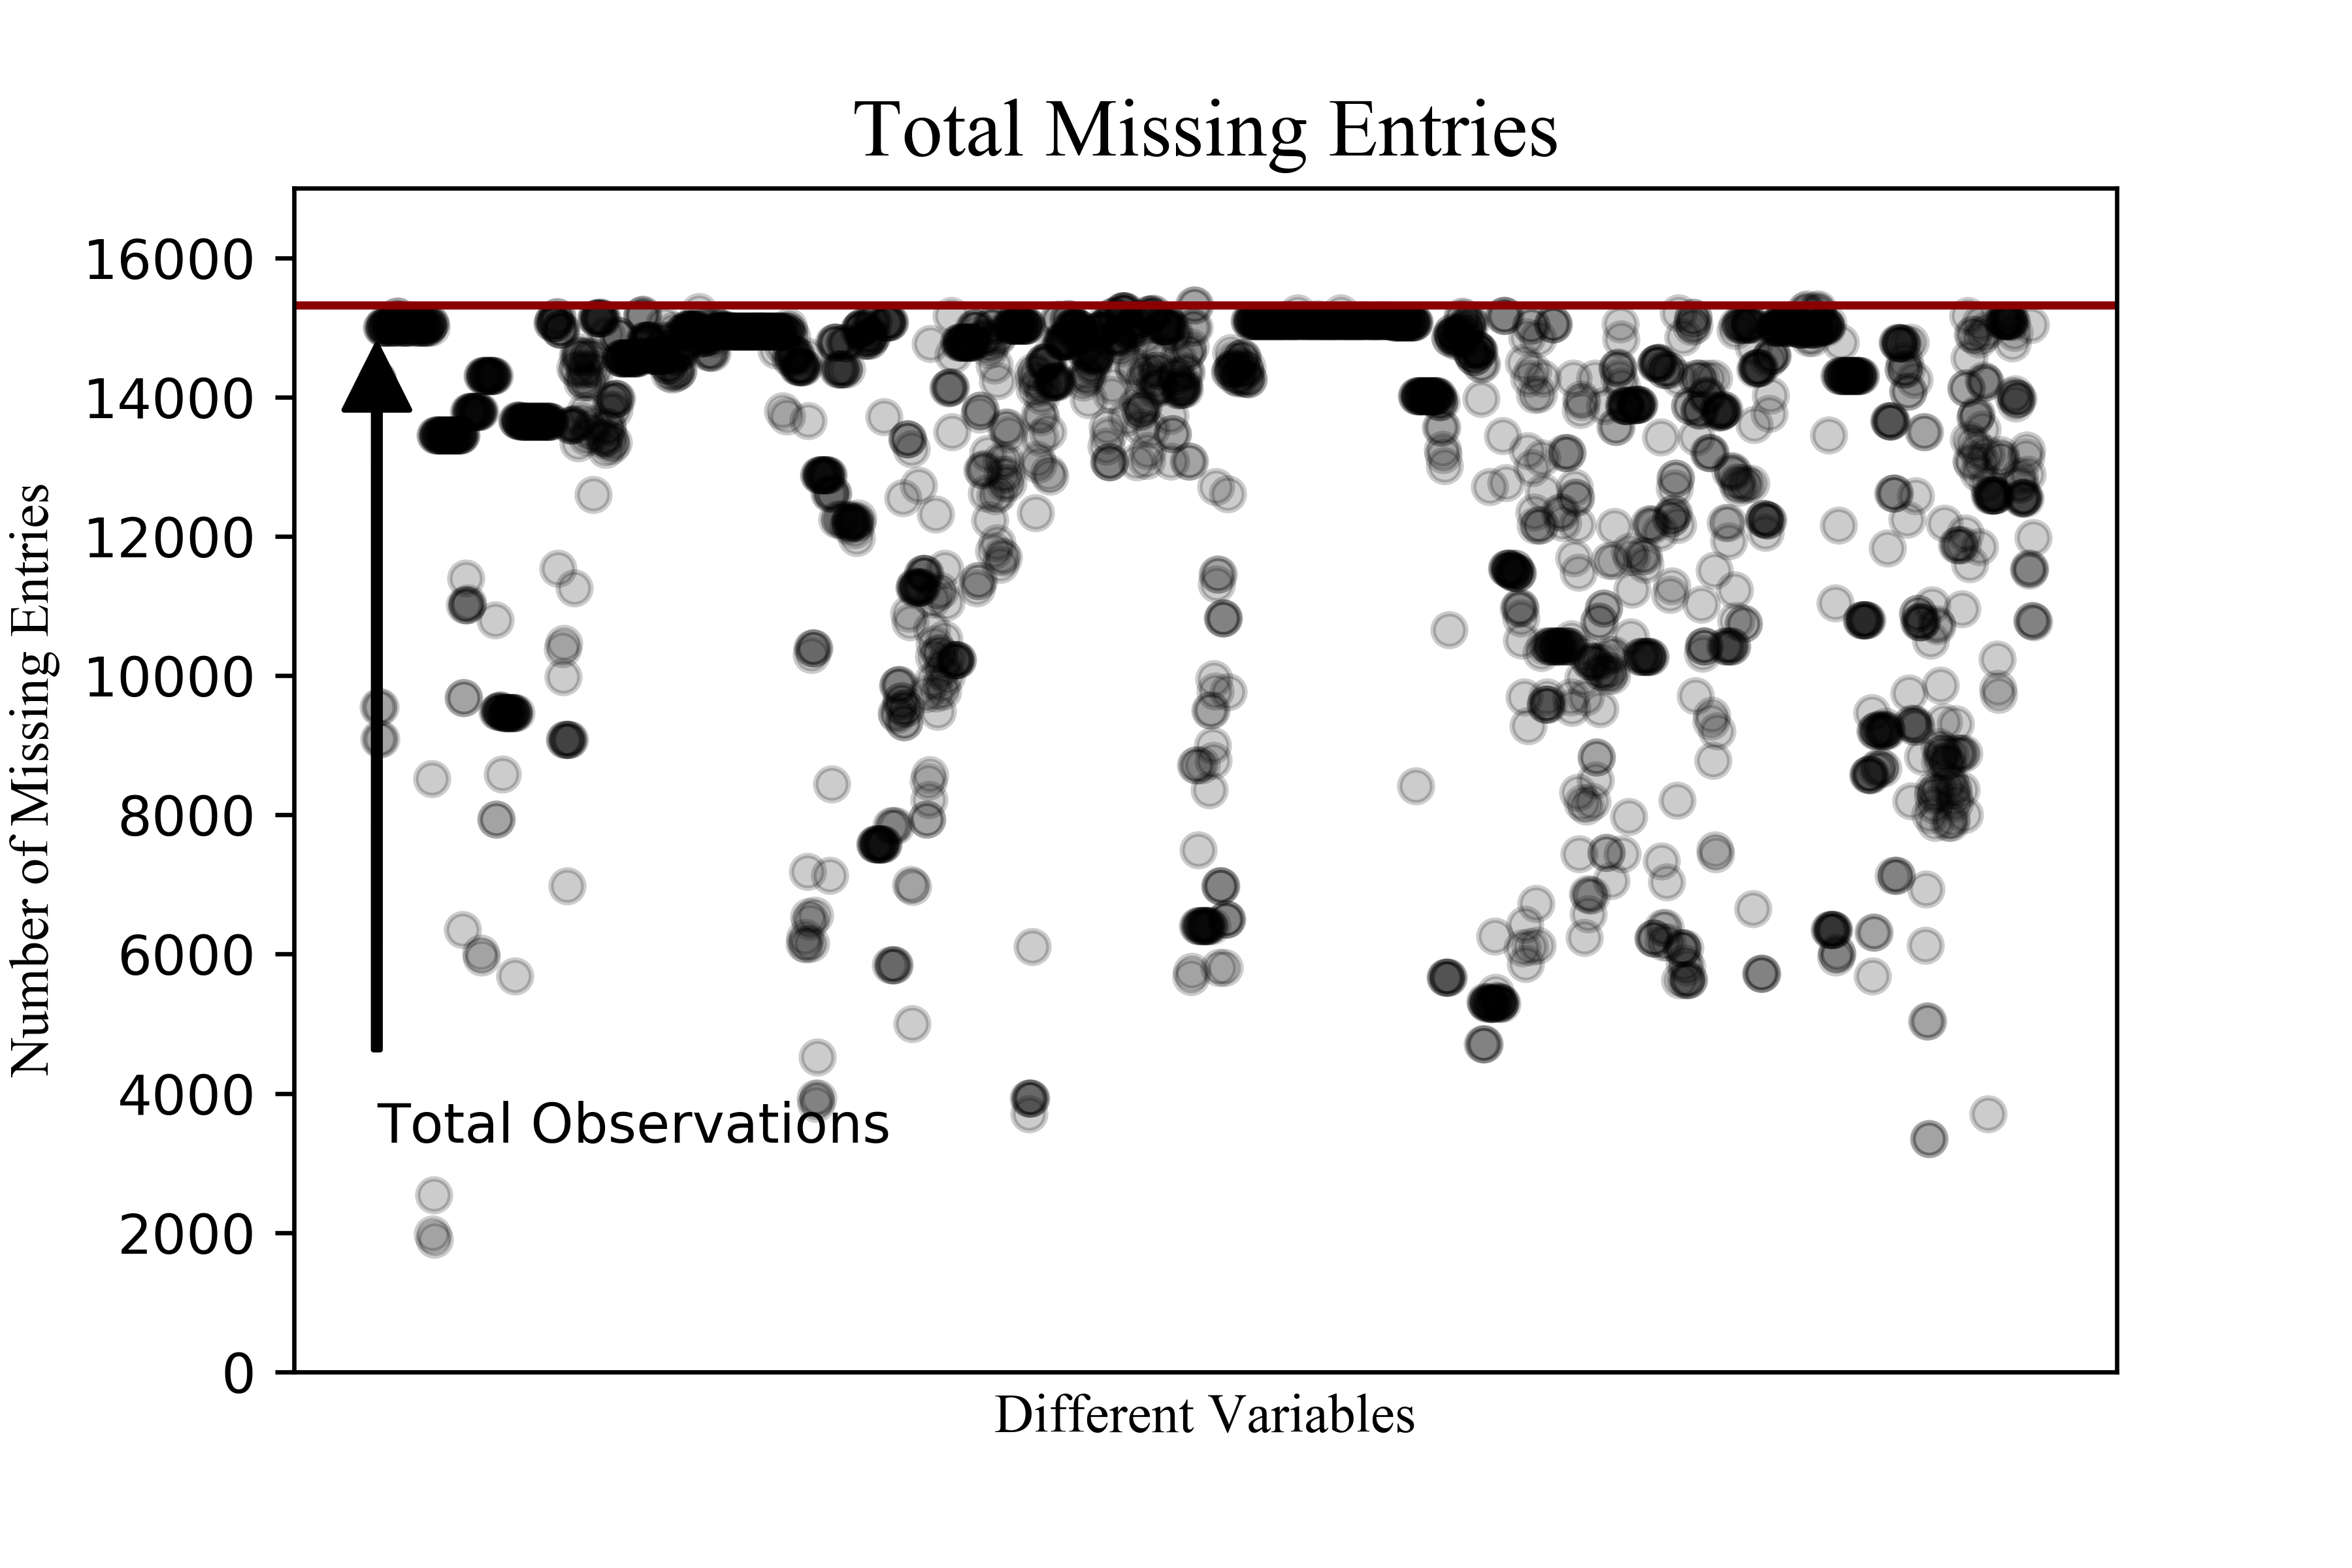
To address this, Singular Value Decomposition via the data interpolating empirical orthogonal functions (DINEOF) is employed to address gaps in the data (Taylor et al., 2013). Principal Component Analysis (PCA) is then utilized for dimensionality reduction, capturing 81.94% of data variance through the first 15 principal components. The resulting dataset is standardized and prepared for analysis.
Uppsala Conflict Data Program
| Country Name | Year | Type of Violence | Deaths | |
| Count | 225385 | 225385 | 225385 | 225385 |
| Unique | 122 | 31 | 3 | 614 |
| Mean | --- | 2009 | 1.42 | 11.3 |
| Min. | --- | 1989 | 1 | 0 |
| 25% | --- | 2004 | 1 | 1 |
| 50% | --- | 2012 | 1 | 2 |
| 75% | --- | 2015 | 1 | 5 |
| Max. | --- | 2019 | 3 | 48183 |
In parallel, the Uppsala Conflict Data Program (UCDP) provides the Georeferenced Event Dataset (GED) to measure conflict intensity, disaggregated by individual events of organized violence (Pettersson, T. et Öberg M., 2020; Sundberg, R. et Melander, E., 2013). Aggregating this data to a country-year unit of analysis reveals patterns of armed conflict, particularly by non-state actors, across different governance quality clusters.
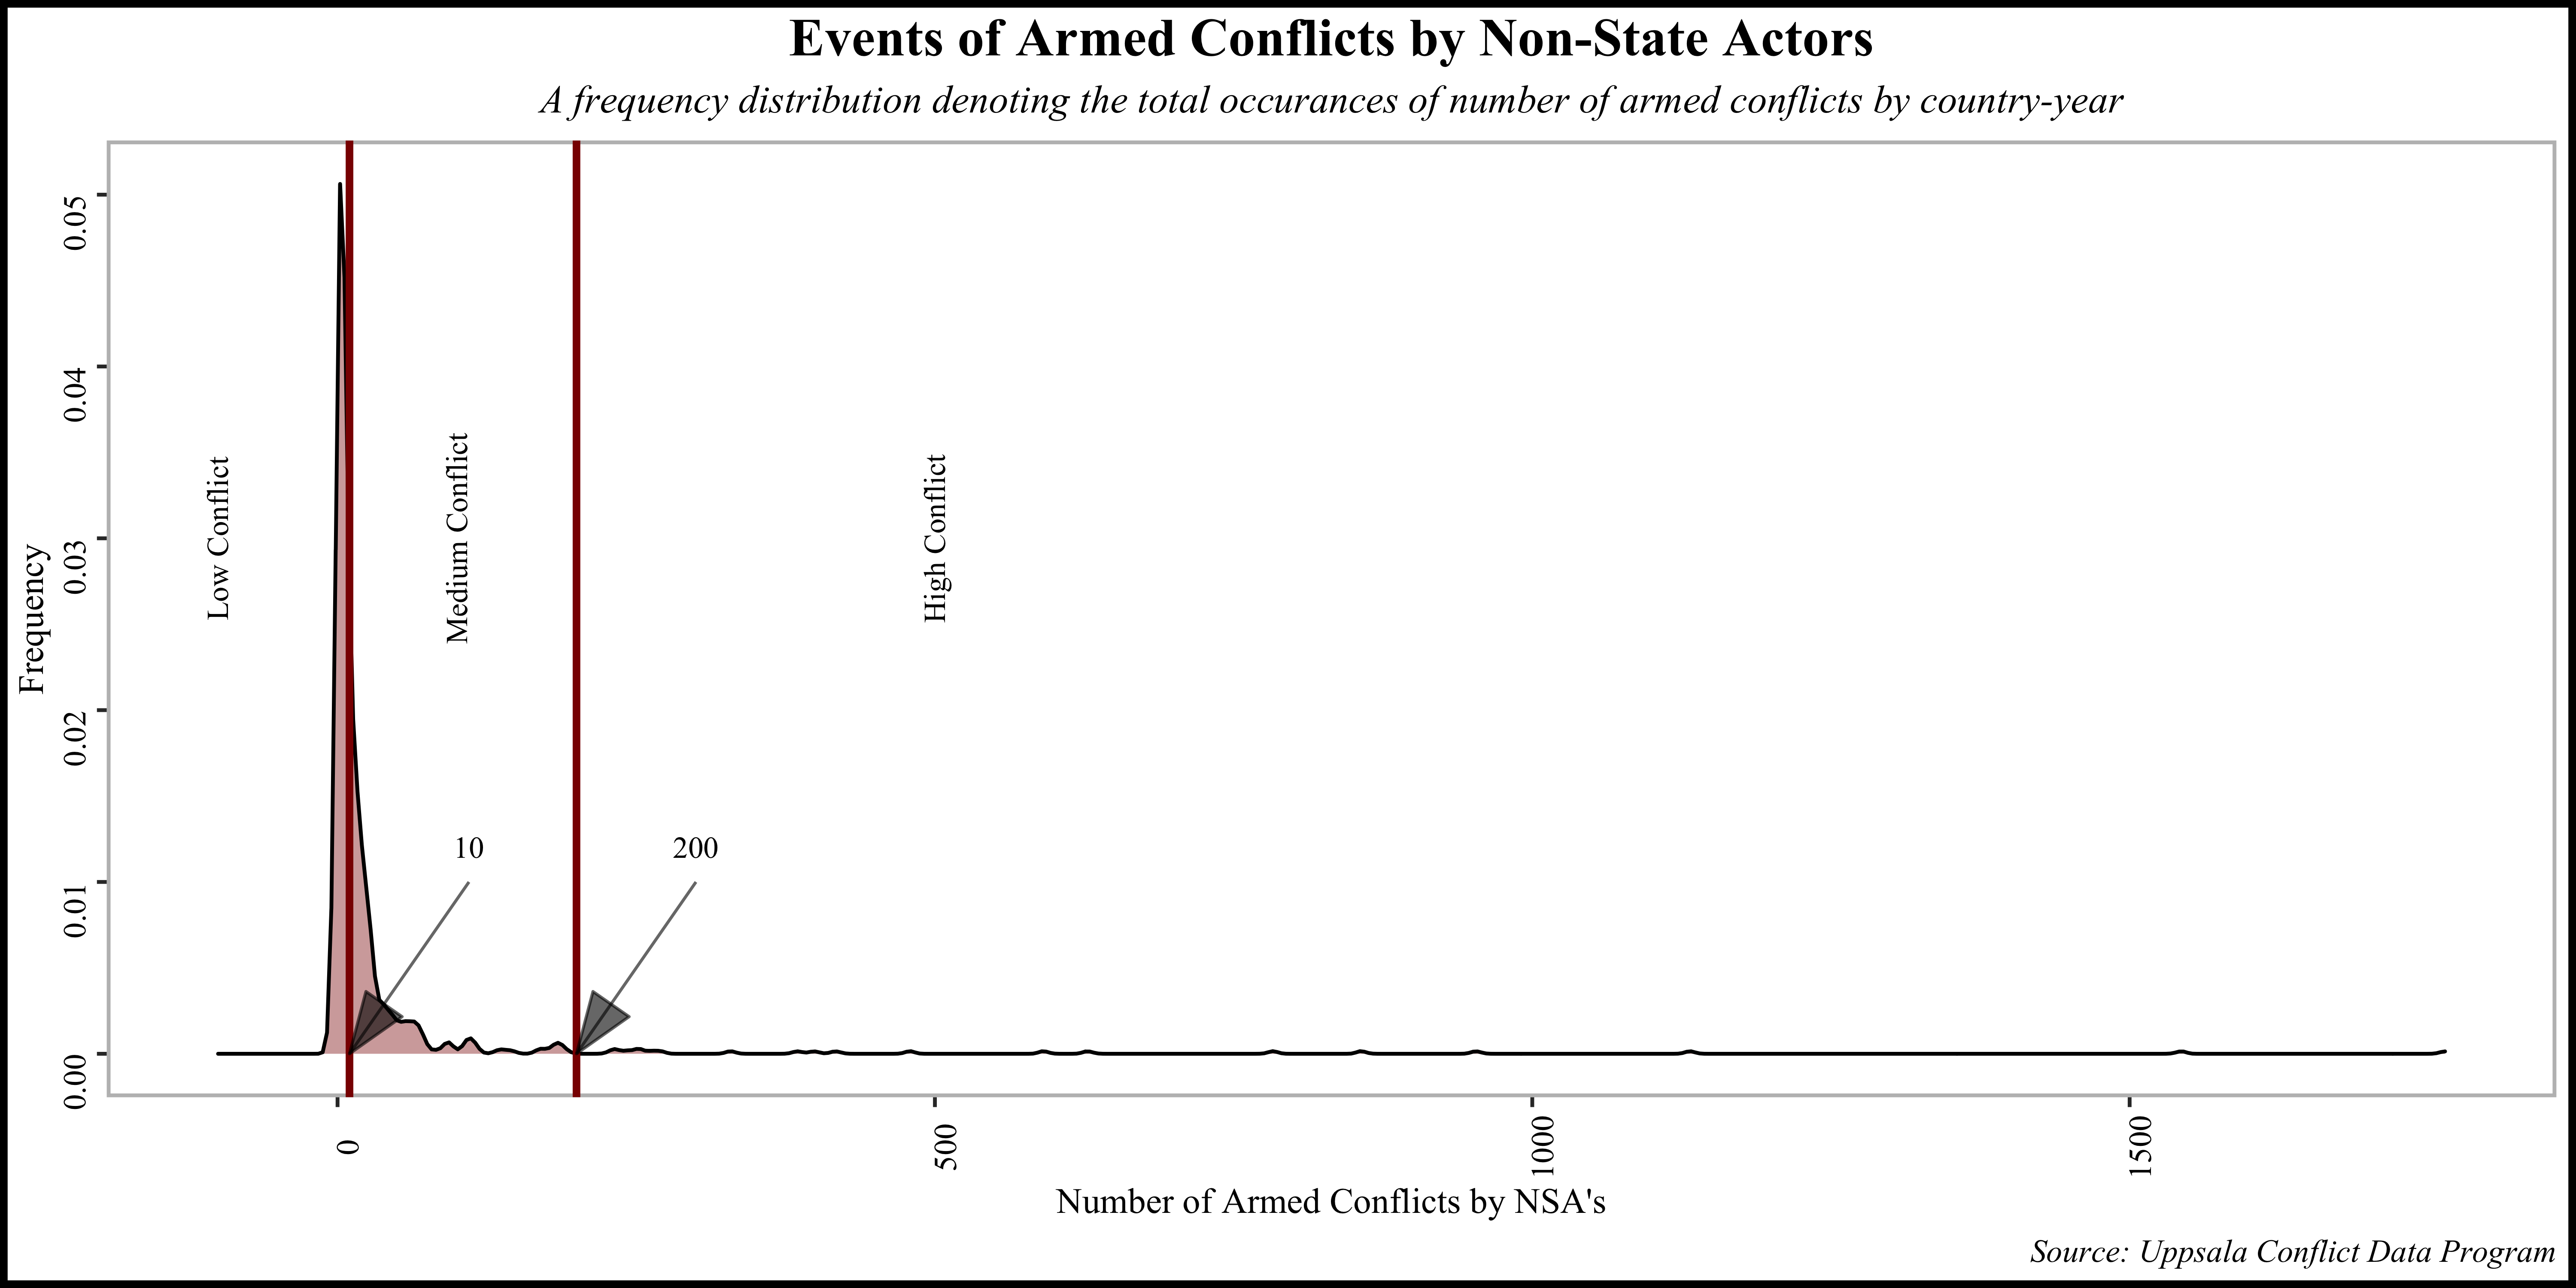
Exploratory analysis, such as plotting the total aggregated number of events by country-year and creating conflict intensity bins, provides insights into the relationship between governance quality clusters and armed conflict levels, setting the stage for further analysis and interpretation.
Methodological Approach
Addressing missing data in the dataset posed a challenge, rendering standard approaches like singular value decomposition (SVD) impractical due to the inability to decompose matrices with missing values (Taylor et al., 2013). While eigen decomposition of the covariance matrix (least squares empirical orthogonal functions - LSEOF) is an option, it can yield negative eigenvalues, leading to overestimation of other variables' magnitudes (Beckers and Rixen, 2003; Björnsson and Venegas, 1997).
Instead, the data interpolating empirical orthogonal functions (DINEOF) method was employed. This iterative SVD algorithm fills missing values with unbiased guesses, with non-missing values treated as gaps and substituted with unbiased guesses as well. The iterative process continues until all missing values are filled (Beckers and Rixen, 2003; Alvera-Azcárate et al., 2005).
Principal Component Analysis (PCA) was then applied to the imputed data, reducing its dimensionality. PCA is an unsupervised machine learning technique that summarizes datasets into higher-order lower-dimensional principal components capturing overall variability (B. Ping et al., 2015). From over 2100 features, the first 15 principal components were selected, explaining 81.94% of the data's variance (Figure 2).
Next, agglomerative hierarchical cluster analysis was chosen to identify similar clusters. This method, extensively used in comparative political economy settings, accounts for the hierarchical structure inherent in the governance dataset (Obinger & Wagschal, 2001; Saint-Arnaud & Bernard, 2003). Unlike K-means clustering, hierarchical clustering does not require predefining the number of clusters (k). Given the data's outliers and potential variations in cluster sizes and densities, hierarchical clustering, particularly the ward method of linkages, was deemed suitable (Figure 6 & 7).
Findings
Utilizing the ward linkage method for agglomerative hierarchical clustering, we obtained dendrograms representing various cluster configurations. Starting with two clusters, we observed a grouping of countries as wholes rather than individual country-year pairs. However, as we increased the number of clusters to six, a clearer distinction emerged between country-year pairs from different decades.
Examining the relationship between clusters and conflict levels revealed that while high-conflict observations tended to cluster together, medium and low-conflict clusters lacked distinctiveness. Even though the Uppsala Conflict Data Program's dataset didn't offer definitive insights into conflict patterns, the interactive visualizations shed light on the grouping of similar countries.
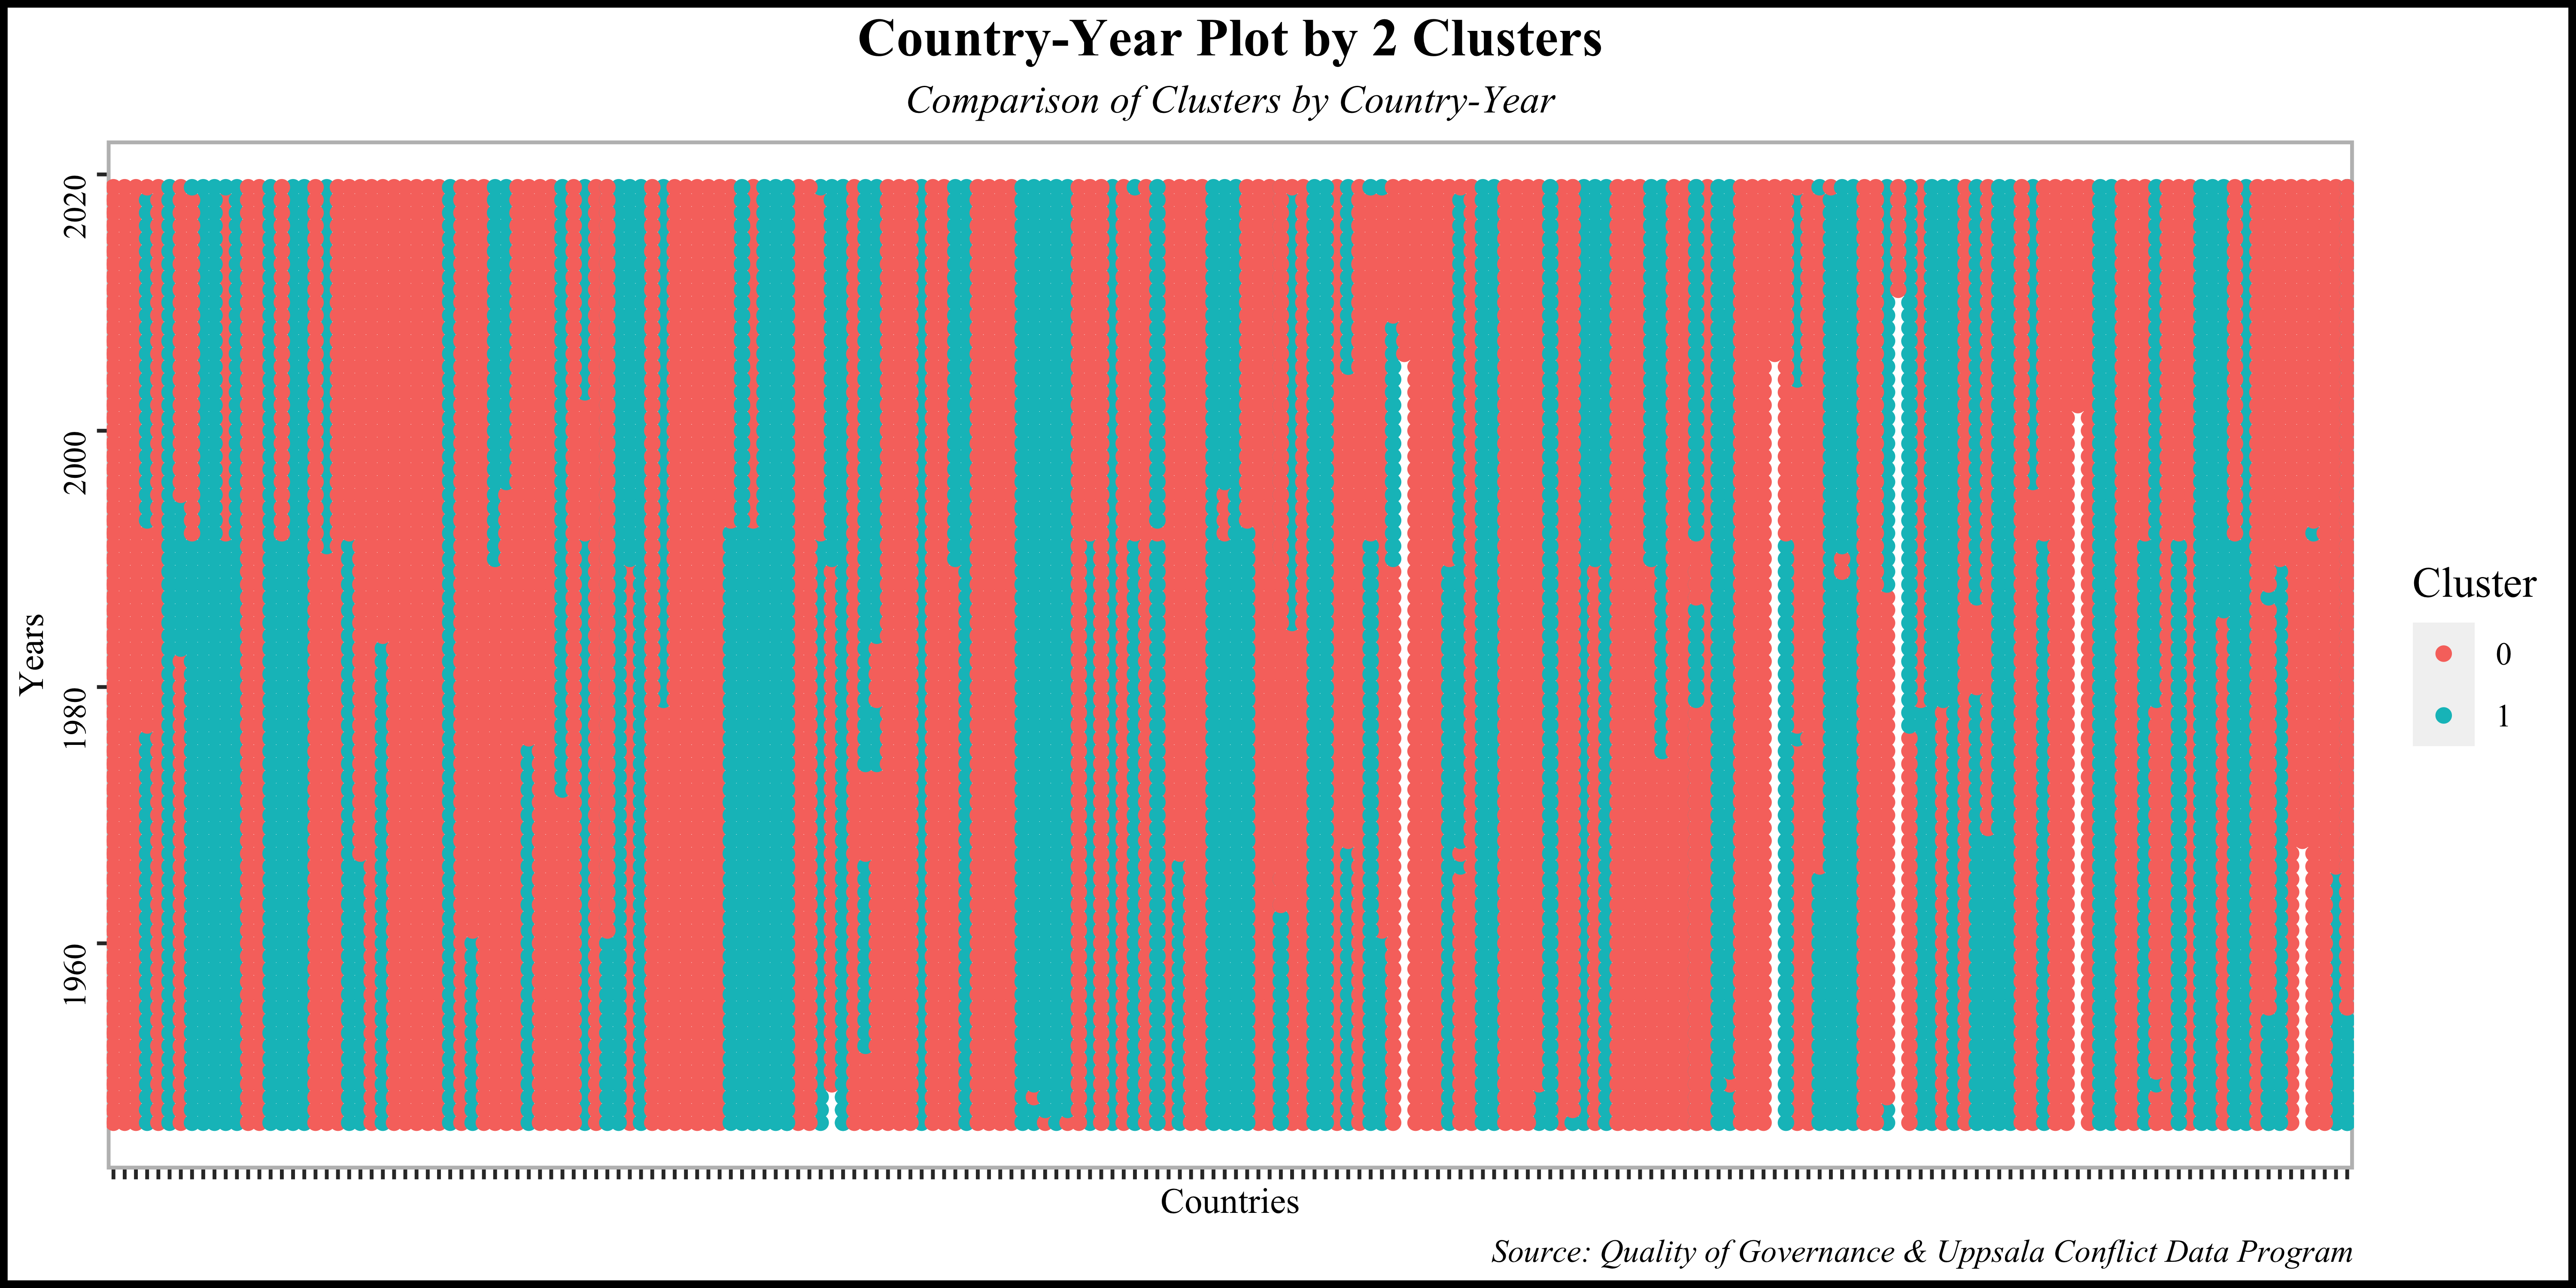
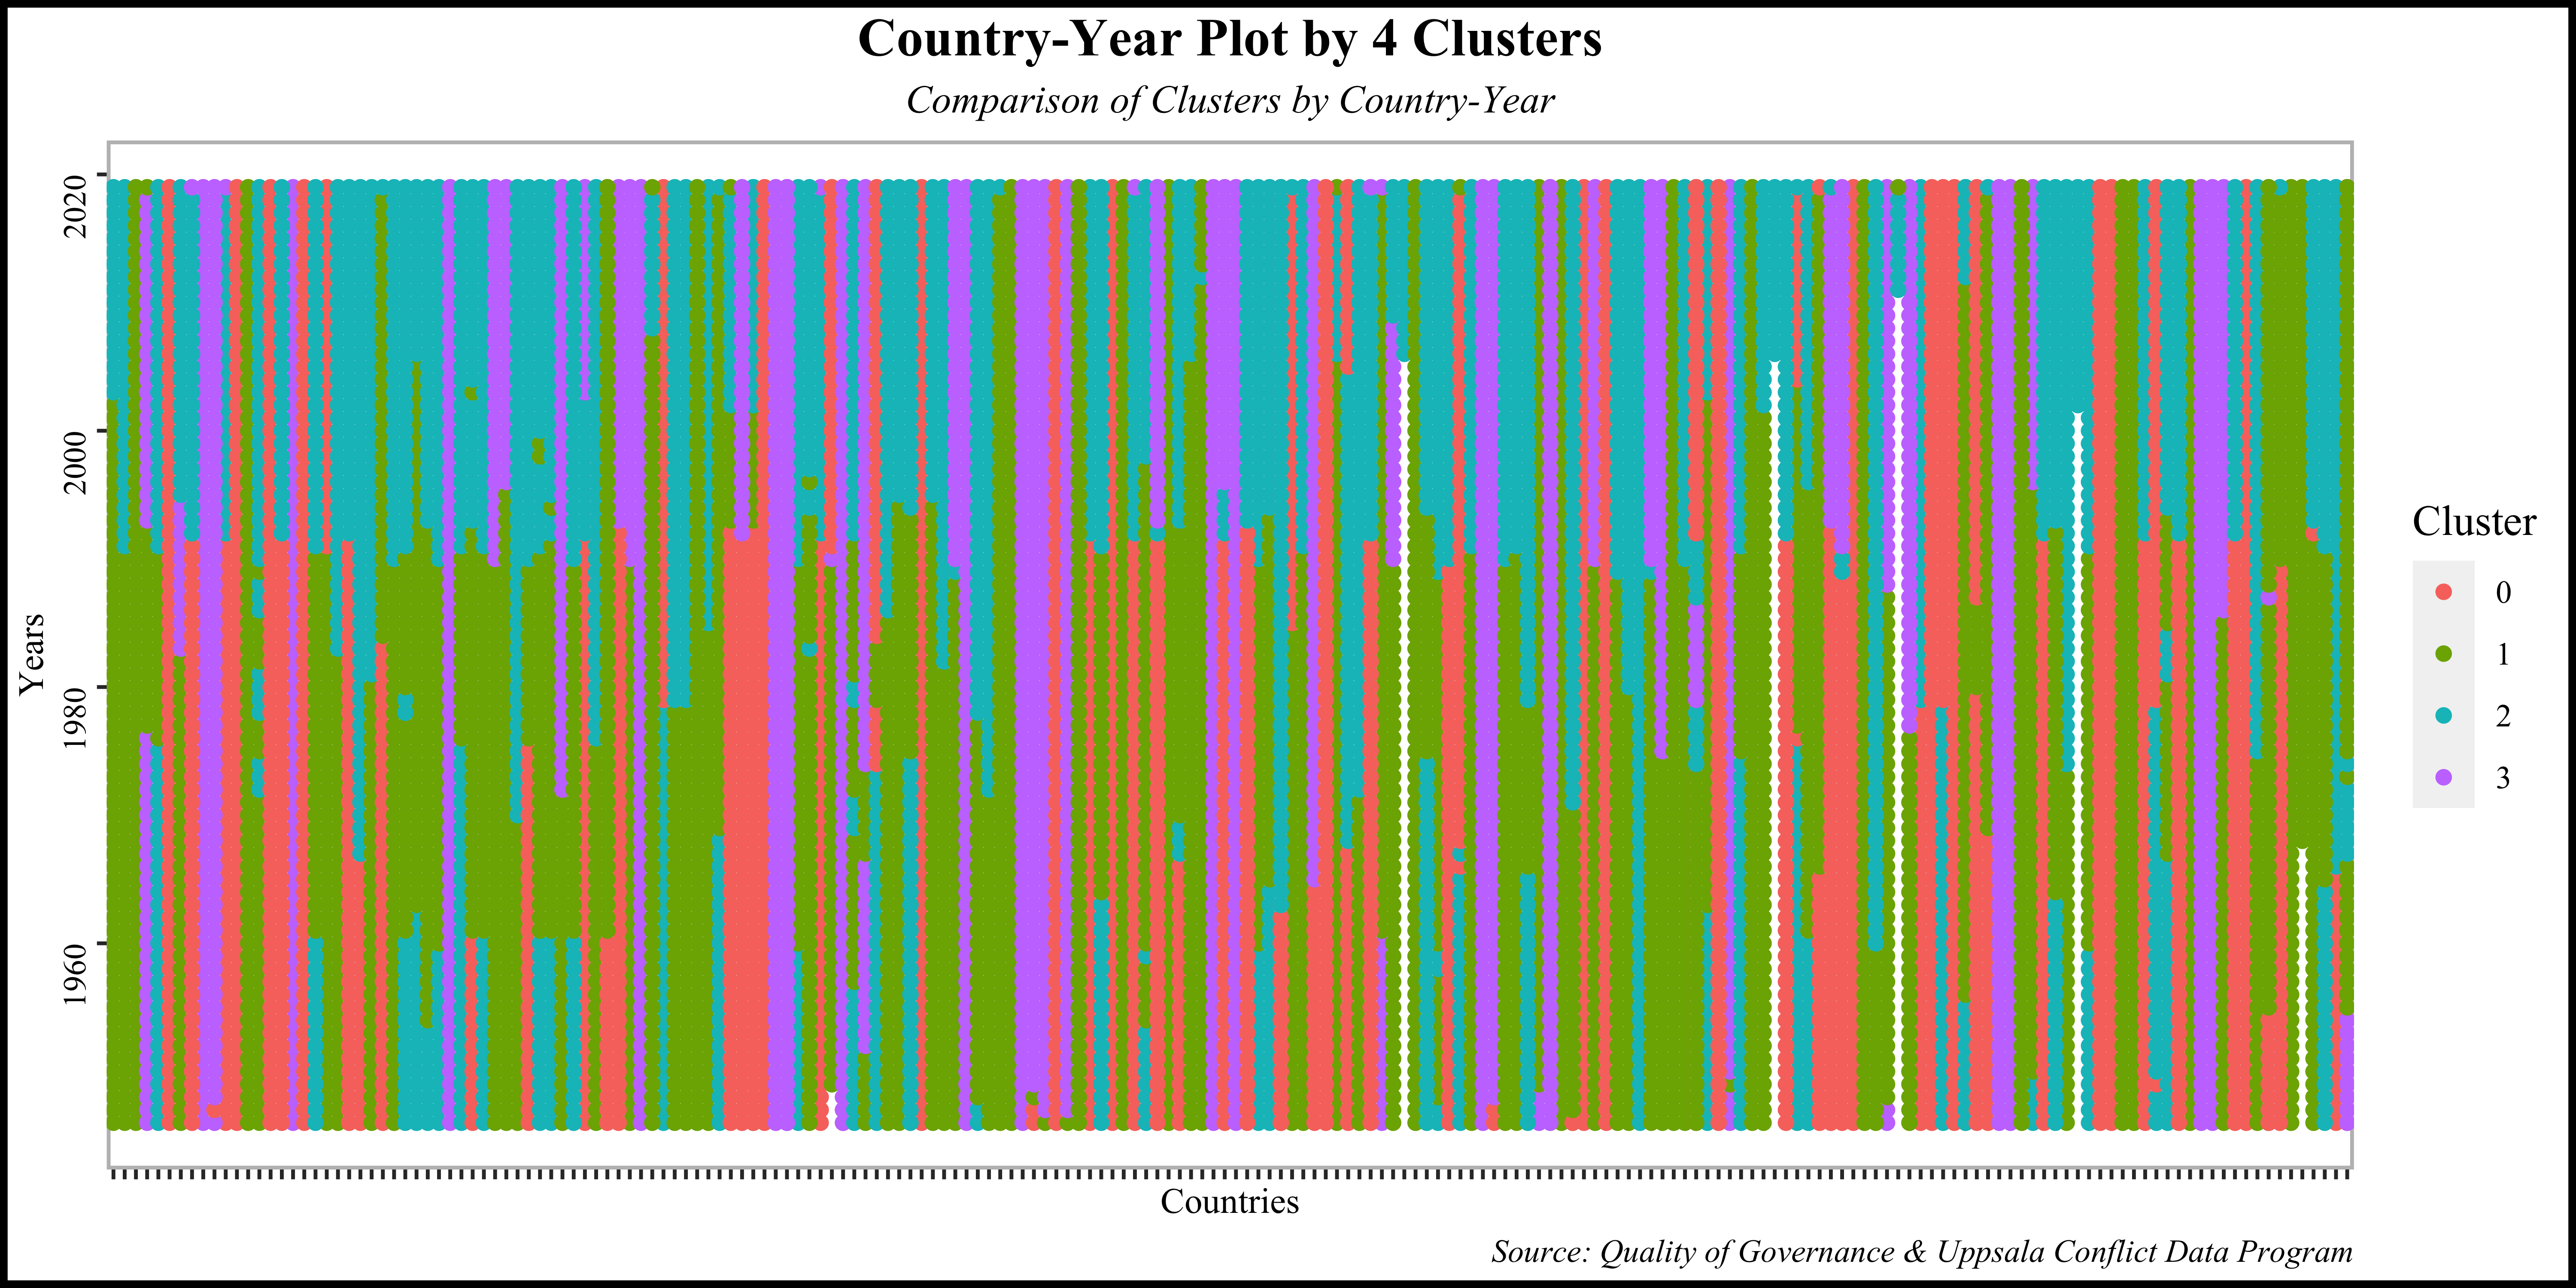
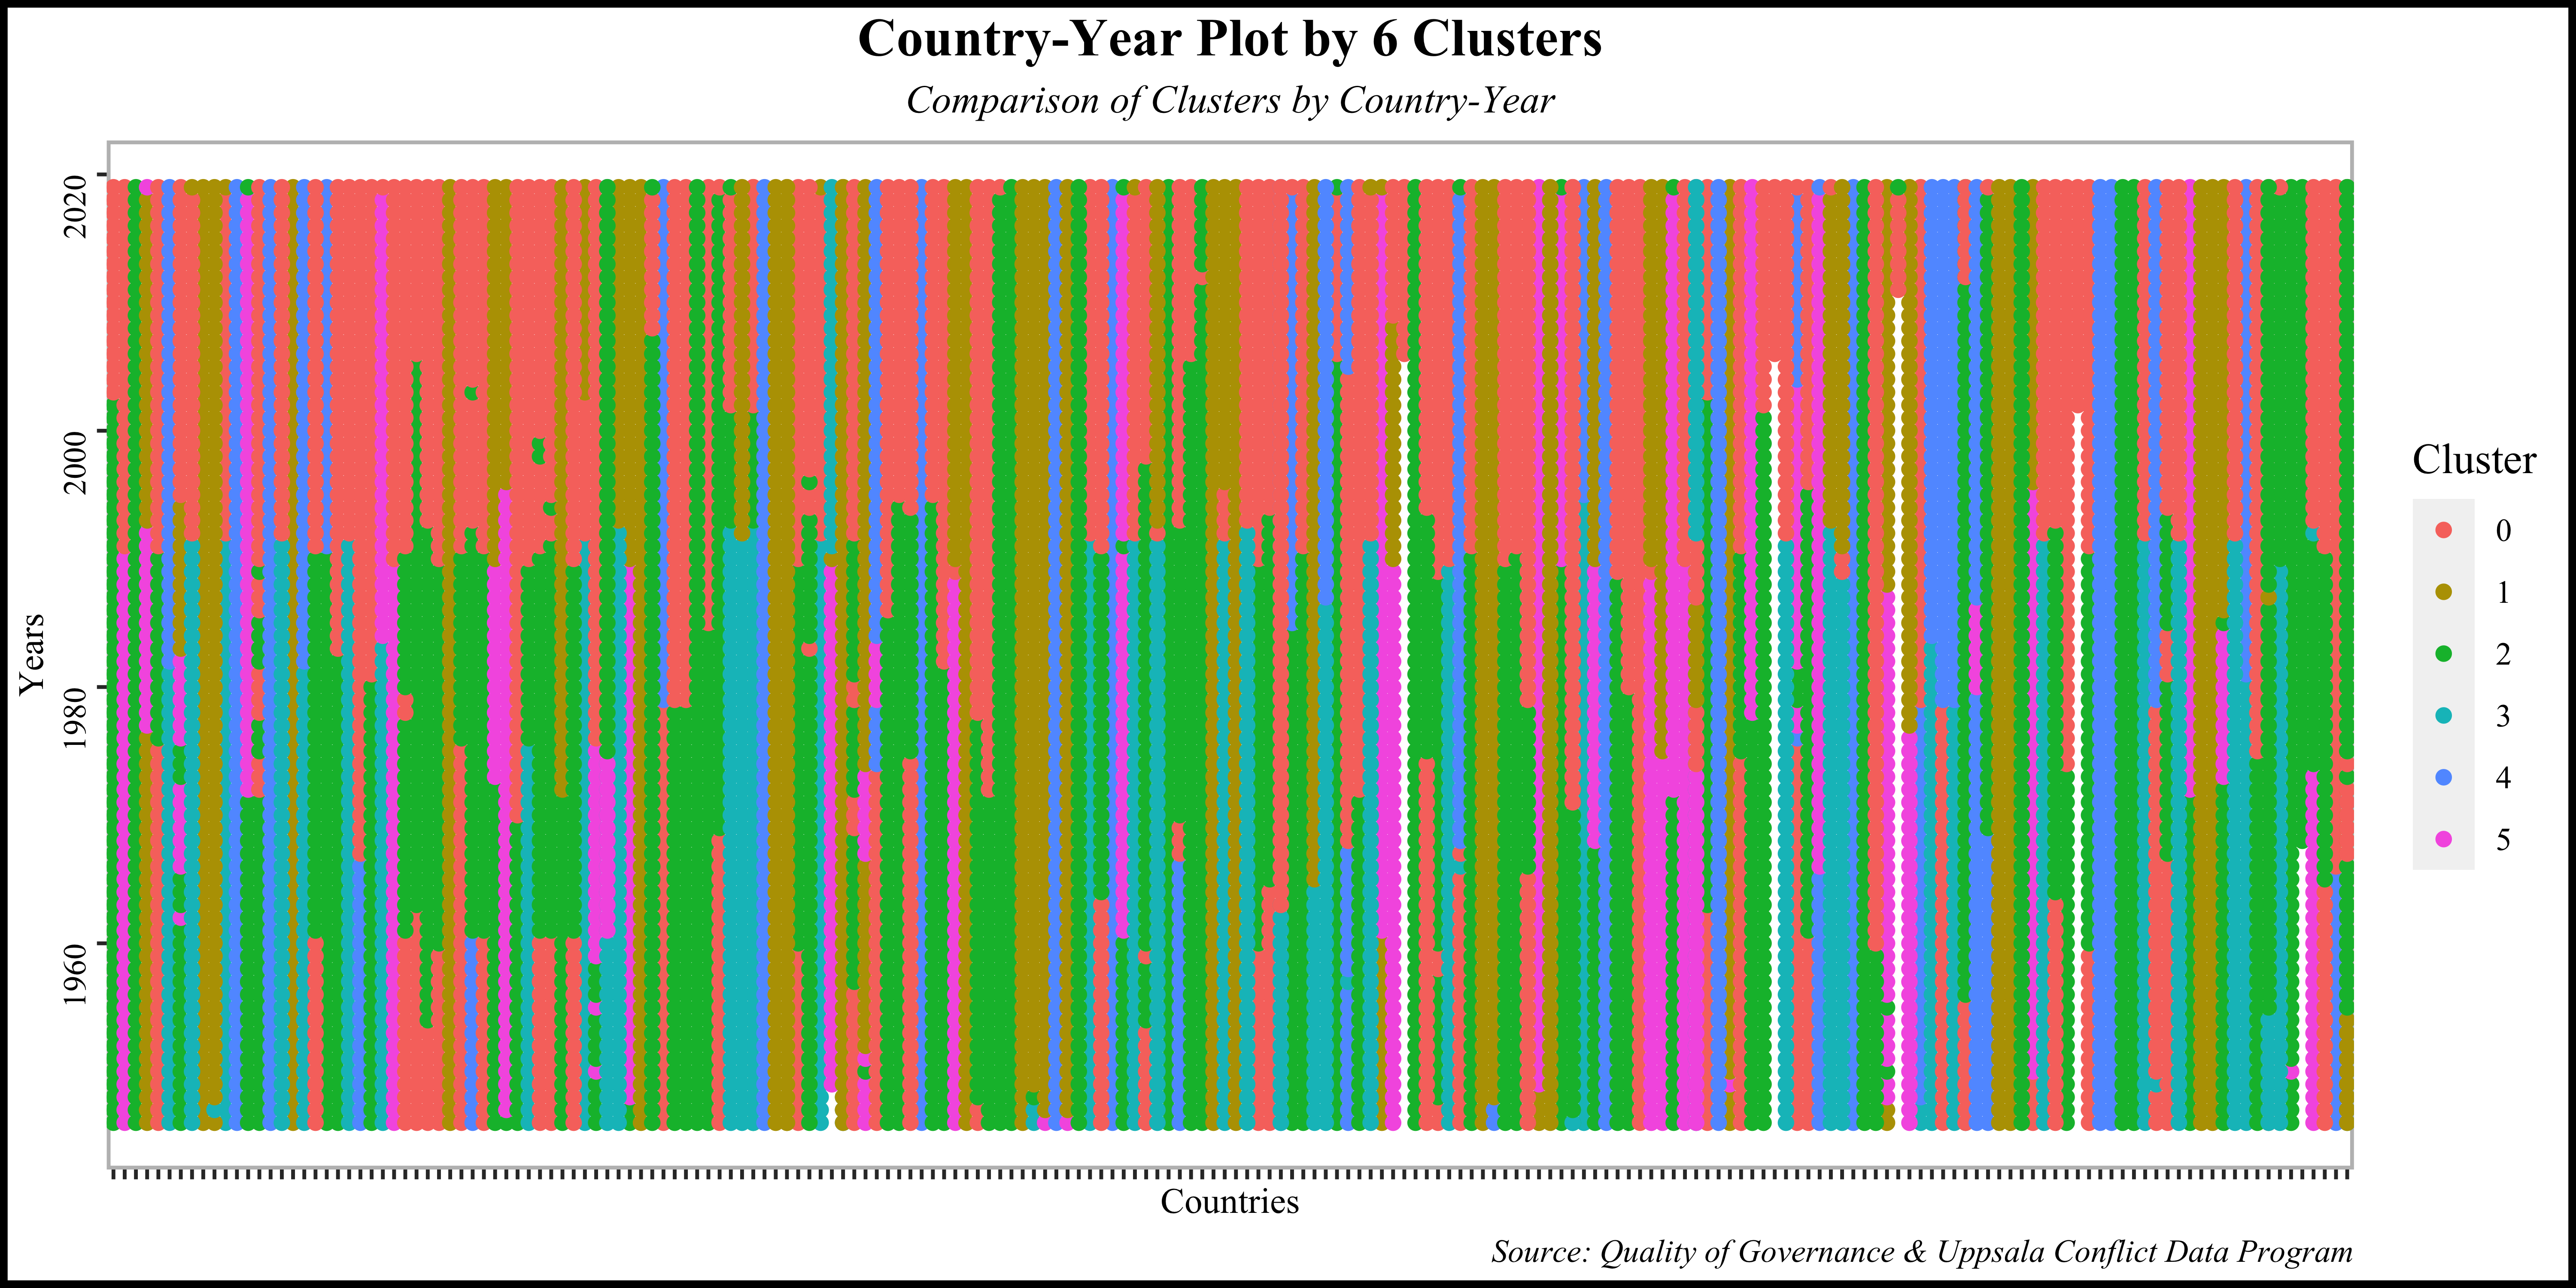
Notably, the six-cluster configuration revealed clustering patterns corresponding to geopolitical regions, with distinct groupings such as North America and Europe, the Middle East and North Africa, and Asia, Latin America, and Africa. While our analysis didn't directly correlate governance with conflict, it highlighted the influence of governance on political economy. Although governance may not directly drive conflict, similarities in governance structures among nations experiencing conflict suggest its indirect impact on geopolitical dynamics.
Conclusion
In this analysis, I utilized Principal Component Analysis and hierarchical clustering to explore the relationships between countries based on their governance levels. While these techniques provided clustering insights, the interpretation of these clusters remains subjective. Delving deeper into the clusters could reveal intriguing patterns and potential explanations for their formation.
Despite the comprehensive nature of the Quality of Government dataset, the limited availability of data in the Geo-referenced Event Dataset posed a challenge to our analysis. Additionally, the lack of a clear rationale for the clustering patterns observed further underscores the complexity of the analysis.
Although our findings did not directly correlate specific governance types with levels of conflict, the clustering patterns highlight notable differences within countries over the last two decades. However, attributing these differences solely to governance factors requires further investigation.
In conclusion, while this project provides foundational insights, there is still much room for refinement and deeper exploration. The clustering patterns observed in 2017 suggest that political economy may not be directly correlated with conflict at a general level, indicating the need for nuanced analysis and consideration of various factors influencing geopolitical dynamics.
Bibliography
- Ahlquist, J. S., & Breunig, C. (2009). Country clustering in comparative political economy. In MPIfG Discussion Paper (No. 09/5; MPIfG Discussion Paper). Max Planck Institute for the Study of Societies. https://ideas.repec.org/p/zbw/mpifgd/095.html
- Good Governments—Vallandingham.me. (n.d.). Retrieved November 9, 2020, from http://vallandingham.me/world_gov_challenge/
- Obinger, H., & Wagschal, U. (2001). Families of nations and public policy. West European Politics, 24(1), 99–114. https://doi.org/10.1080/01402380108425419
- Pettersson, Therese & Magnus Öberg (2020) Organized violence, 1989-2019. Journal of Peace Research 57(4). (n.d.).
- Ping, B., Su, F., & Meng, Y. (2015). Reconstruction of Satellite-Derived Sea Surface Temperature Data Based on an Improved DINEOF Algorithm. IEEE Journal of Selected Topics in Applied Earth Observations and Remote Sensing, 8(8), 4181–4188. https://doi.org/10.1109/JSTARS.2015.2457495
- Refs.cgi.txt. (n.d.).
- Saint-Arnaud, S., & Bernard, P. (2003). Convergence or Resilience? A Hierarchical Cluster Analysis of the Welfare Regimes in Advanced Countries. Current Sociology, 51(5), 499–527. https://doi.org/10.1177/00113921030515004
- Shaw, M. N. (2008). International Law. Cambridge University Press. http://public.ebookcentral.proquest.com/choice/publicfullrecord.aspx?p=377898
- Sundberg, Ralph and Erik Melander (2013) Introducing the UCDP Georeferenced Event Dataset. Journal of Peace Research 50(. (n.d.).
- Taylor, M. H., Losch, M., Wenzel, M., & Schröter, J. (2013). On the Sensitivity of Field Reconstruction and Prediction Using Empirical Orthogonal Functions Derived from Gappy Data. Journal of Climate, 26(22), 9194–9205. https://doi.org/10.1175/JCLI-D-13-00089.1
- Teorell, J., Dahlberg, S., Holmberg, S., Rothstein, B., Alvarado Pachon, N., & Axelsson, S. (2020). QoG Standard Dataset 2020 [Data set]. University of Gothenburg: The Quality of Government Institute. https://doi.org/10.18157/QOGSTDJAN20
- Venables, W. N., & Ripley, B. D. (2010). Modern Applied Statistics with S (4. ed., [Nachdr.]). Springer.